A Review of Accident Hotspots
Traffic safety is one of the major problems of modern societies, and thousands of people are killed or injured in traffic accidents every year. Instead of traditional approaches to traffic safety, the concept of “Vision Zero”, a system approach to traffic safety, has emerged. This approach aims to eliminate traffic accidents completely. The Vision Zero approach requires a focus on reducing the likelihood of accidents by examining the causes of traffic accidents. Analyzing accident data is therefore important to develop solutions towards this goal. These analyses are important for improving safety culture, identifying dangerous situations and behaviors, predictability and taking proactive measures.
Analysis of traffic accidents provides valuable information to reduce the frequency of accidents, minimize injuries and casualties, and create an overall safer environment. Reducing traffic accidents through data-driven analysis and appropriate measures aims to ensure the safety of drivers, pedestrians and other road users.
Analyzes of accident data are important tools used to make important decisions for traffic safety. Data analysis and statistical methods have become a powerful tool for understanding traffic accidents, identifying their causes and taking effective measures. Accident black spots analysis enables the identification of areas or points where traffic accidents are concentrated. The identification of accident black spots reveals priority areas for traffic management and infrastructure arrangements. In this way, it is aimed to prevent accidents by taking safety measures in these areas.
Descriptive Analysis of Accident Data
Descriptive analysis of traffic accidents is a method used to understand the distribution and pattern of accidents over time. This analysis aims to understand the factors affecting traffic by identifying in which years, months (Figure 1), seasons, days or hours (Figure 2) accidents are concentrated. For example, it can be observed that there may be more accidents in certain time zones or that weather conditions may increase accidents in certain seasons. Traffic flow is more likely to be affected during peak hours. For example, it can be observed that accidents increase during rush hour or holiday periods. The most common types of accidents can be identified and matched by location, time and accident type.
This information can be used to identify times when traffic controls are increased or alternative routes are recommended. It can provide important information for planning and implementing traffic safety measures. For example, traffic control can be increased during peak accident hours or special warnings can be issued to drivers during high-risk seasons.

Figure 1 Distribution of Accidents by Month between 2017-2021
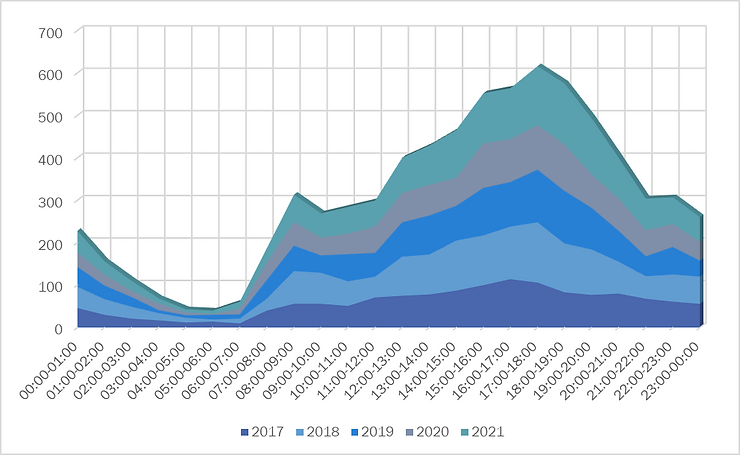
Figure 2 Distribution of Traffic Accidents by Hours between 2017-2021

Figure 3 Distribution by Accident Types between 2017-2021
Spatial Investigation of Traffic Accidents and Identification of Accident Black Spots
Spatial analysis of traffic accidents is a method that enables the identification of risky areas by examining the regions where traffic accidents occur. This analysis involves mapping the points where accidents occur based on their geographical location. Detailed analyses can be made on factors such as driver errors, intersections, and road conditions in areas where accidents are high. Different methods can be used depending on the purpose of the study and the scale of the study area: Getis Ord Gi*, Anselin Local Moran’s I, Nearest Neighbor Hierarchical Clustering and Empirical Bayes Method.
The hot spot analysis results according to the Getis-Ord G* Method are shown in Figure 4 and the analysis results according to the Anselin Local Moran’s I Method are shown in Figure 5. According to these results, the high density city center and its surroundings (red dots) were identified as accident hot spots with 90%-99% confidence level. An accident hotspot indicates that there are more accidents than expected, i.e. high-density accident zones. These are areas with interrelated or clustered accidents. The areas that can be considered as the periphery of the city have been identified as accident cold spots with 90%-99% confidence level. Accident cold zone refers to areas with fewer accidents than expected, i.e. low-intensity accident zones.

Figure 4 Getis-Ord G* Method

Figure 5 Anselin Lokal Moran’s I Method
Bu yöntemler kaza sıcak bölgelerini tespit ederken bölgesel kümelenmeye odaklanmaktadır. Kavşak ve yol segmenti özelinde daha detaylı sonuçlar elde edebilmek için “En Yakın Komşuluk Hiyerarşik Kümelenmesi” yöntemi kullanılarak da kent merkezindeki kaza kara noktaları tespit edilmiştir.
Bu çalışma kapsamında En Yakın Komşuluk Hiyerarşik Kümelenme Yönteminde kaza kara noktaları 1000 m, 500 m, 200 m, 100 m ve 75 m eşik mesafeleri; minimum 5,10,20 ve 50 nokta parametreleri kullanılarak hesaplanmıştır (Şekil 6, Şekil 7, Şekil 8, Şekil 9, Şekil 10).
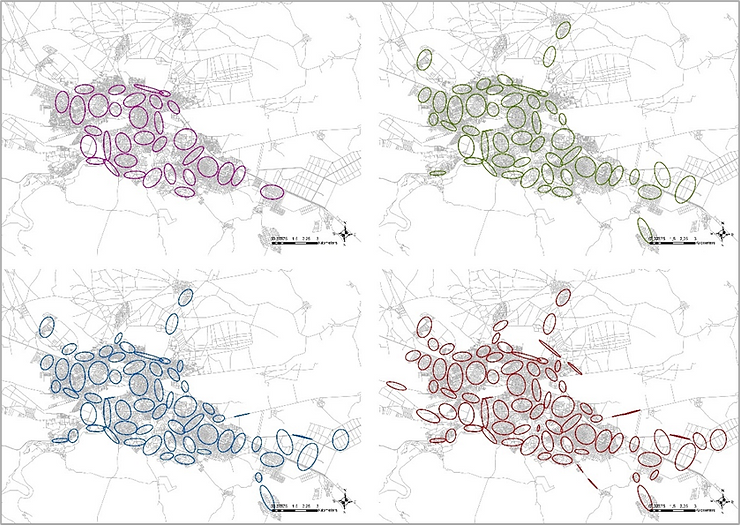
Figure 6 Accident Black Spots Calculated with 1000 m Threshold Value
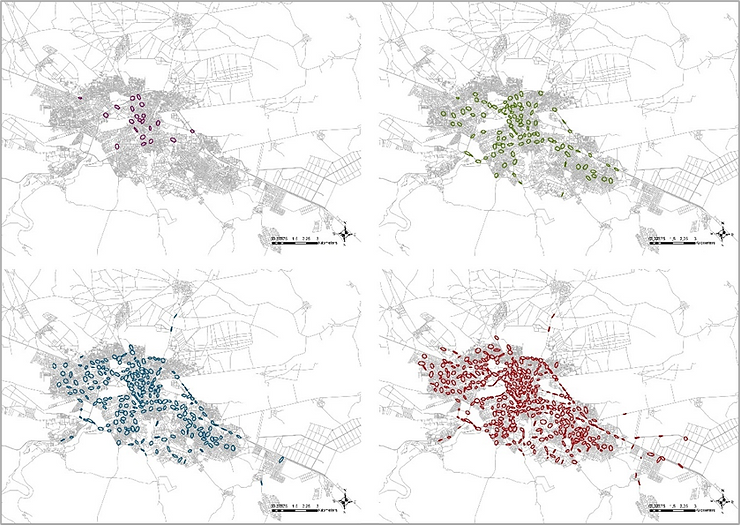
Figure 7 Accident Black Spots Calculated with 500 m Threshold Value

Figure 8 Accident Black Spots Calculated with 200 m Threshold Value
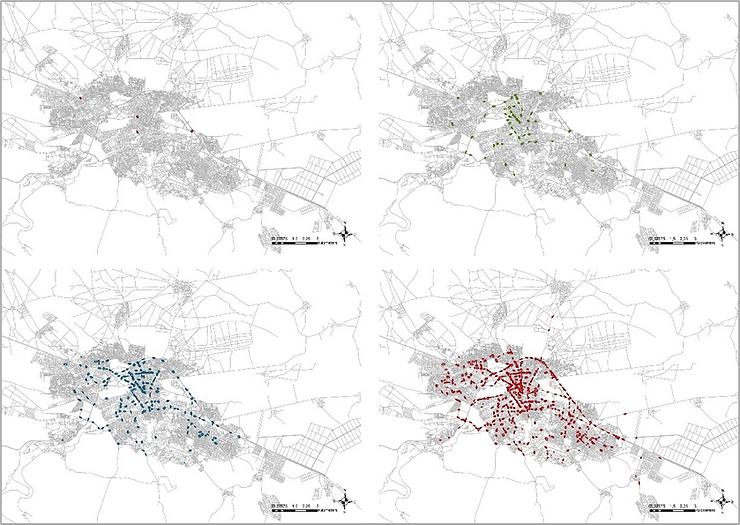
Figure 9 Accident Black Spots Calculated with 100 m Threshold Value
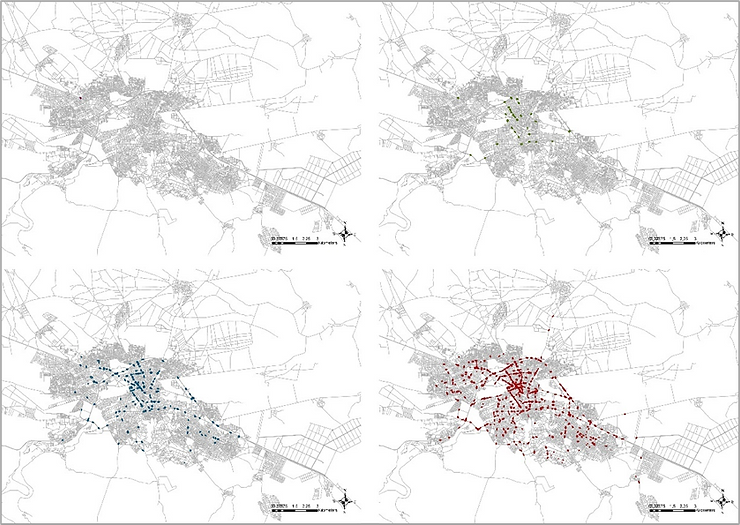
Figure 10 Accident Black Spots Calculated with 75 m Threshold Value
The Empirical Bayes Method was applied at road segments and intersections for all years, and accident prediction data was obtained at each point for the 5-year period between 2017 and 2021. By comparing the obtained accident forecasts with the recorded data collected from the accident points, accident black spots were identified for road segments and intersections. The results obtained according to the Empirical Bayes method applied at a particular intersection are given in Table 1. While a total of 37 accidents were expected to occur for the 5-year period, the number of observed accidents was 58 in the accident forecasts made by the Empirical Bayes Method using the current traffic volume and characteristics of the intersection.
Table 1 Results of the Empirical Bayes Method

Results that can be obtained by finding accident black spots:
- The root causes of traffic accidents: By finding accident black spots, it is possible to understand the root causes of recurring accidents in a given area or road section.
- Safety measures that need to be improved: Identifying black spots highlights safety gaps in the area or road segment. For example, it may indicate that measures need to be taken, such as adding barriers or warning signs, making road adjustments or changing traffic signals.
- Solutions to Improve Traffic Flow: Understanding how a particular black spot affects traffic flow enables solutions to be developed to reduce traffic congestion in the area. Various measures such as road widening, creating alternative routes or rearranging traffic signalization can be considered at this point.
- Analysis of User Behavior: Studying accidents at black spots provides an opportunity to understand and evaluate driver behavior. For example, frequent accidents in a particular area can often be attributed to certain behavioral patterns, such as speed violations, reckless driving or alcohol/impaired driving.
- Strategies to Prevent Future Accidents: Identifying black spots helps to develop strategies to prevent future accidents. Data analysis and the study of traffic patterns can guide the planning and implementation of preventive measures
REFERENCES
AASHTO, 2010. The Highway Safety Manual, American Association of State Highway Transportation Professionals, Washington, D.C.
Blazquez, C. A., & Celis, M. S. (2013). A spatial and temporal analysis of child pedestrian crashes in Santiago, Chile. Accident Analysis & Prevention, 50, 304-311.
Colagrande, S., 2022. A methodology for the characterization of urban road safety through accident data analysis. Transportation Research Procedia, 60 (2021), 504–511.
Dereli, M. A. (2016). Trafik kaza kara noktalarının belirlenmesi için Coğrafi Bilgi Sistemleri (CBS) destekli mekânsal istatistiksel metotlar ile bir model geliştirilmesi.
Geçer, H., Bitim, S., Coskun, E. & Ayancı, M. (2013). Trafik Kazalarının Analizi Amaçlı Interaktif ve Web Tabanlı Bir Karar Destek Sistemi Önerisi. Retrieved from https://www.researchgate.net/publication/270816790_Trafik_Kazalarinin_Analizi_Amacli_Interaktif_ve_Web_Tabanli_Bir_Karar_Destek_Sistemi_Onerisi
Getis, A. & J. K. Ord (1992). The Analysis of Spatial Association by Use of Distance Statistics. Geographical Analysis 24(3), 189-206.
Golembiewski, G. Ve Chandler, B. E. (2011). Roadway Safety Information Analysis: A Manual for Local Rural Road Owners. United States Department of Transportation (Rapor No: FHWA-SA-11-10). Retrived from https://rosap.ntl.bts.gov/view/dot/42608
Goodchild, M. (1986). Spatial Autocorrelation. GeoBooks, Norwich, UK: 57.
İlçi, V. (2013). Trafik Kaza Kara Noktalarının Mekânsal İstatistiksel Yöntemlerle Belirlenmesi: Afyonkarahisar-Konya Örneği. Afyon Kocatepe Üniversitesi Jeodezi ve Fotogrametri Mühendisliği Anabilim Dalı. Yüksek Lisans Tezi. Retrieved from https://acikerisim.aku.edu.tr/xmlui/handle/11630/6158
Moran, P. A. P. (1948). The interpretation of statistical maps. Journal of the Royal Statistical Society, Series B 37(2): 243–251.
Prasannakumar, V., Vijith, H., Charutha, R., & Geetha, N. (2011). Spatio-temporal clustering of road accidents: GIS based analysis and assessment. Procedia-social and behavioral sciences, 21, 317-325.
